With the rise of intense instrumentation and data recording capacities in industrial and computational systems, there has become a very large number of variables for system operators or process operators to monitor. This can be a very challenging task because the volume of data is so large and growing. Industrial systems such as chemical plants may have tens of thousands of variables which are measured continuously. Large server farms and cloud systems can similarly have a large number of hardware and software defined variables being tracked continuously.
Critically, the data are multivariate and have correlations or are otherwise interrelated and the maximum value of analyzing the data can only be accessed by simultaneous evaluation. To assist human operators in assimilating the volume of data available, the development of automatic data analysis systems has been an on-going area of interest.
Statistical process control (SPC) has the goal of detecting and eliminating the impact disturbances, such as abnormal inputs, hardware or software failures. SPC works in concert with the automatic control systems which work to maintain the controlled variable at the desired value (1). There is a tremendous diversity in the techniques and technologies employed to monitor and analyze operations. In this blog post I provide a surface level overview of a couple monitoring techniques, and discuss the similarities between technology and industrial applications of process monitoring. Finally, I close with a suggestion that there is a big opportunity at the intersection of big data analytics and industrial systems.
Classic Univariate or Low Dimensional Methods
Monitoring charts are one of the simplest and most widely deployed techniques for statistical quality control and operational monitoring. A basic univariate statistical approach is to determine limit thresholds for each observation variable. These upper and lower limits define an acceptable quality range for each variable. If the measured value falls outside of this band it indicates a fault and prompts a diagnostic analysis to determine an assignable cause, or otherwise gives an alert.
The determination of the thresholds limits for an observation variable introduces a trade-off between the false alarm rate (false positive) and the missed detection rate (false negative). If the limits on the acceptable quality band are too tight the false alarm rate will be too high, and if the limits too broad the missed detection rate will be too high.
Shewhart Chart (more on Wikipedia more from NIST)
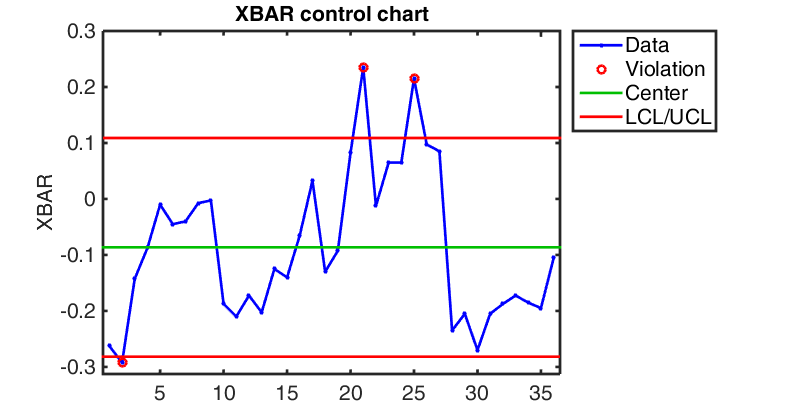
The Shewhart chart or \bar{\mathbf{X}} chart plots the sequence of observations directly as univariate measures with upper and lower control limits defined based on the known, expected, observed distribution of observations. The mean of our quantity of interest is defined as \mu_x and the standard deviation as \sigma_x then the Upper Control Limit (UCL) and Lower Control Limit (LCL) are defined as:
UCL = \mu_x + k \sigma_x LCL = \mu_x - k \sigma_x ,
where the parameter k determines the thickness of the acceptable band, often set to 3 for a total acceptable range of six sigma. Cumulative Sum Chart (more from NIST)
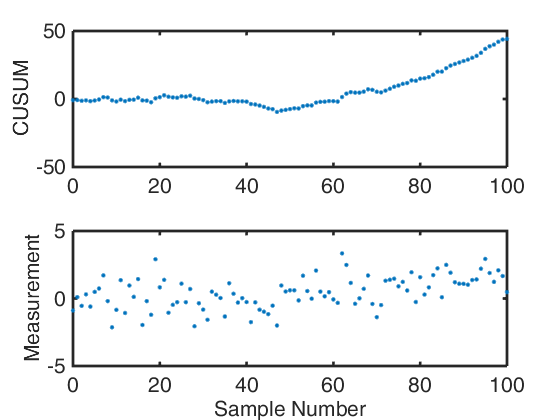
The Cumulative Sum Control Chart or CUSUM Chart is another popular type of univariate chart of statistical process control. CUSUM works by plotting the cumulative sum of against the sample number after subtracting the estimate of the in-control mean from the data. The cumulative sum is calculated as:
S{m} = \sum{i=1}^{m}(\bar{x}{i} - \hat{\mu}{0}) \,\,\,\,\,\,\, \mbox{or} \,\,\,\,\,\,\, S{m}’ = \frac{1}{\sigma{\bar{x}}} \sum{i=1}^{m}(\bar{x}{i} - \hat{\mu}{0}), with the sample number m and \hat{\mu}{0} the estimate of the in-control (nominal) mean, and \sigma_{\bar{x}} the known or estimated standard deviation of the sample means. If the process remains in control the variation should be randomly scattered around 0. If the process mean changes or is incorrectly estimated, this will be observed in a drift of the CUSUM chart. Which can be seen in the example above.
Other techniques for producing univariate control charts and alerting thresholds are well established, including using exponentially weighted moving averages, or other sliding window techniques, and developing rules for alerting thresholds based on requiring a certain number of samples crossing a threshold.
Operating Windows
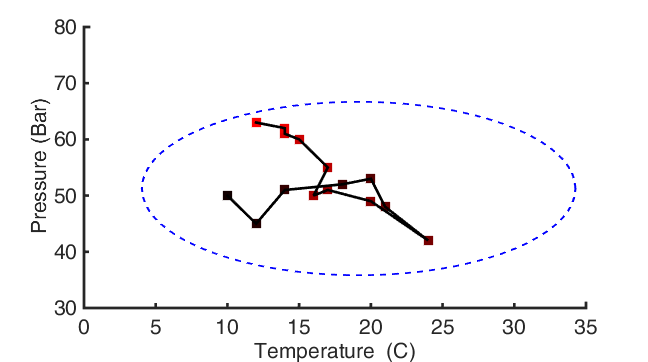
In a small number of dimensions, critical process attributes can be tracked visually and have a defined region where the control systems, and built-in measures are expected to keep things behaving nominally. For example we can imagine a very simple case of a storage tank for a liquid like petroleum distillates. In monitoring the tank the two critical process parameters are the tank’s temperature and the tank’s pressure. In order to ensure the tank doesn’t rupture the allowable temperature and pressure windows form an irregular window based on the physical limits of the tank design, and the availability of a cooling or venting system. In this arbitrary example, we see a time course of measurements from red to black, and a bounding outline in blue for the operating window. These windows can be defined relatively simply in low numbers of dimensions, and include complex features such as multiple discrete and disconnected operating regimes. When monitoring many variables these need to be described mathematically and visual interpretations are necessarily a projection or other mapping to a much lower dimensional space.
Challenges for Statistical Process Control
In a modern operation whether in oil drilling, chemical manufacturing, or a server farm several challenges exist. Some of these challenges are addressable with scaling up of traditional methods but other require advances in implementation of multivariate techniques. Several of the challenges are familiar to anyone who has been following the on-going conversations about big data, namely, data volume, data velocity and data variety.
- Large volume: Automatic data logging systems continuously store data. The large volume makes manual probing almost impossible. Large volumes of data also create computational demands for data access. The standard proposed solution is to utilize distributed commodity computational infrastructure, however working in this kind of environment requires a new infrastructure solution versus already deployed systems.
- High dimensionality: The behavior of a process is usually defined by a large number of correlated variables. As a result it is difficult to visualize the behavior of the process, or construct operating envelopes without dimension reduction.
- Process uncertainty and noise: Uncertainty and noise emphases the need for good data pre-processing techniques.
- Dynamics: In operational status identification, it is very important to take account of the dynamic trends. In other words, the values of variables are dynamic trends. Many data mining and knowledge discovery tools, such as the well-known inductive machine learning systems, are not able to handle variables that take values as dynamic trends.
- Difference in the sampling time of variables: On-line measurements and offline measurements can have variable sampling periods that don’t agree or are not consistent during the life of the process.
- Incomplete or missing data: Some important data points may not be recorded, or may be only intermittently available.
- Complex interactions between process variables: Many techniques require that attributes be independent. However, many process variables are interrelated.
- Seasonality or periodicicty: The process or input conditions to the system may undergo cyclical behaviors often associated with time of day or day of week in user facing systems, and systems impacted by weather conditions.
(List adapted from Wang 1999.)
Anomaly Detection and Diagnosis: SPC Crosses Many Domains
An example of the cross over of domains between industrial and “tech” systems is readily apparently in anomaly detection and diagnosis. The web based marketing data platform, Lytics recently released a set of tools for anomaly detection called Anomalyzer. On this blog I’ve discussed offerings in this space from Twitter and Netflix as well.
All of these packages are designed for univariate analysis for a one dimensional time series of floating point values at a time. In contrast in the engineering and industrial statistical process control literature, methods for handling multivariate methods are quite mature. In the engineering and industrial statistics literature multivariate control charts are a well studied example of using multiple measurements simultaneously and gaining value from the correlation in multiple measurements.
Hotelling in 1947 (more from NIST) introduced the T^2 statistic which is a scalar that combines the information about the distribution of samples in several measurement dimensions. This statistic can be thought of as the multivariate extension of Student’s t-statistic. The expression for the statistic can be given in terms of the vector value of the mean, \bf{m}, observations \bf{X} and inverse covariance matrix \bf{S}^{-1}: T^2 = c( \bf{X-m’} ) \bf{S}^{-1} ( \bf{X-m} ) \, .
By taking into account the correlation of multiple variables practitioners can more effectively control the rates of false positive and false negative alerts in multivariate systems.
#Industrial Systems are A Great Frontier for Data Scientists and Knowledge Exchange
People in lots of different domains are recognizing the value of data and the opportunities present to work in a data driven fashion. In particular to value of data that is being recorded can be surfaced to use historical data to support real time actions and decision making. This bottom up approach of understanding engineered systems based on the data is made more powerful from the availability of low-cost computation and storage, the advancement in computational statistical methodologies, and the improvement in engineering understanding of how to handle data among the workforce.
With a sufficient degree of abstraction a lot of the challenges faced by a network operations engineer, or a site reliability engineering are very similar to those faced by someone monitoring and administering an industrial process. However, there exists a gap in familiarity with the specifics of the problems faced in each domain. This presents an ample opportunity to cross fertilize ideas from multiple previously isolated communities.
It is unlikely the industrial, manufacturing, or chemical engineers will know about columnar data stores, and distributed in memory computation, but traditional big data engineers will have a hard time selling to the chemical manufacturing industry because they don’t understand the problems, and don’t understand the kinds of data and control systems that are already embedded. I expect big advances, and some large enterprises to be formed around this intersection.
Notes:
- Wang, Xue Z. Data mining and knowledge discovery for process monitoring and control. Springer Science & Business Media, 1999.